Westport, CT February 2025 Real Estate Market Insights & Forecasts
City: Westport, CT
Assembled by: Judy Michaelis, 203-247-5000
Hello Westport!
I’m Judy Michaelis. I’m your local real estate expert here with the latest insight into your housing market, as of February 2025.
Whether you’re thinking about buying, selling, or just keeping an eye on the trends, I’ve got you covered. Let’s dive into the numbers.
In January 2025. The median sales price was just over $1.6 million, down 34% from the $2.4 million the previous month, and 15% lower than the $1.8 million in January 2024. This puts prices at mid-level compared to recent years, suggesting a possible leveling off.
However, Westport is a very thinly traded market, one month’s data isn’t enough to call a trend. So be sure to check back next month’s update. Homes are selling faster than before. The average days on the market dropped to 41 days, down 33% from 62 days in December and 57% lower than the 96 days in January of 2024.
This is the lowest level we’ve seen compared to January 24 and 23. In January 2025, only 55 properties were for sale. That’s a big drop from 93 homes in January 2024 and 90 in January 2023. With limited inventory, fewer homes are selling. We had 14 closed sales in January 2025, down 30% form 20 close out in both January 24 and 23.
These stats indicate a competitive market with stable pricing. Many homes in January sold within the first week, often with multiple offers. But since Westport Market is small, one month’s data isn’t enough to predict the year.
So stay tuned for my February update!
If you’re thinking about buying or selling, or just want to chat about the market, reach out! I’d love to provide personal insight for your situation.
And don’t forget to like, subscribe and hit the notification bell to stay updated on Westport Real Estate.
Thanks for watching. See you next time!
Have a look at the numbers below, and let me know what you think!
Sitting down with a top realtor is vital in helping you understand your options. If you’d like to know what’s going on in your part of Westport, or you’re looking for any further detailed analysis, feel free to call, text, or email me – I’d love to have a personal conversation with you. If you like what you see and hear in my videos, just subscribe above!
– Judy
Westport, CT Real Estate Market & Trends Overview
February, 2025
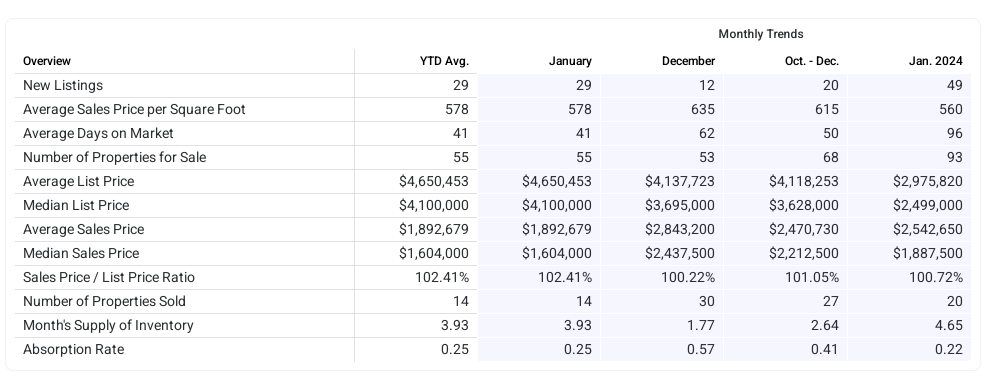
The overview below shows real estate activity for January 2025. You will see data comparisons between January and the previous month, the last three months and January 2024.
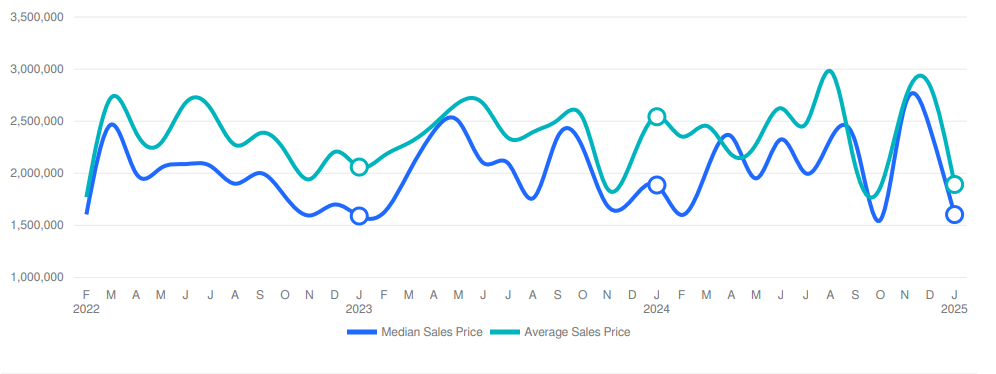
Westport, CT Average and Median Home Sales Prices
February, 2025
The median sales price in January 2025 was $1,604,000, down -34.19% from $2,437,500 from the previous month and -15.02% lower than $1,887,500 from January 2024. The January 2025 median sales price was at a mid level compared to January 2024 and 2023. The average sales price in January 2025 was $1,892,679, down -33.43% from $2,843,200 from the previous month and -25.56% lower than $2,542,650 from January 2024. The January 2025 average sale price was at its lowest level compared to January 2024 and 2023.
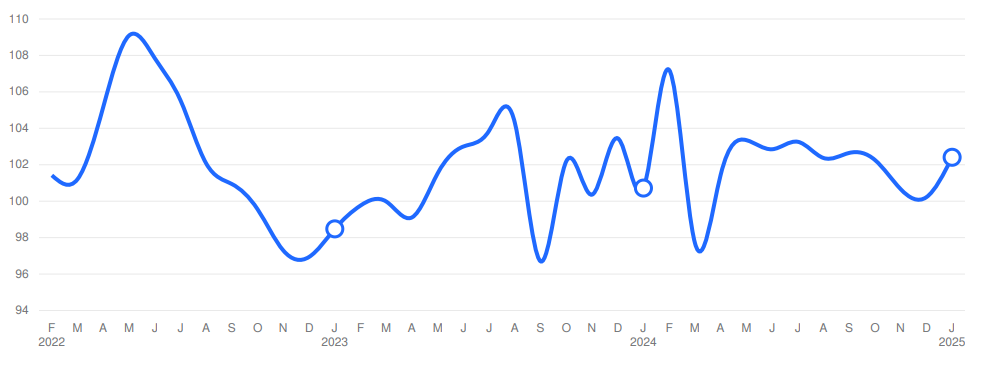
Westport, CT Sales Price / List Price Ratio
February, 2025
The sales price/list price ratio is the average sale price divided by the average list price for sold properties expressed as a percentage. If it is above 100%, homes are selling for more than the list price. If it is less than 100%, homes are selling for less than the list price. The January 2025 sales price/list price ratio was 102.41%, up from 100.22% from the previous month and up from 100.72% from January 2024.
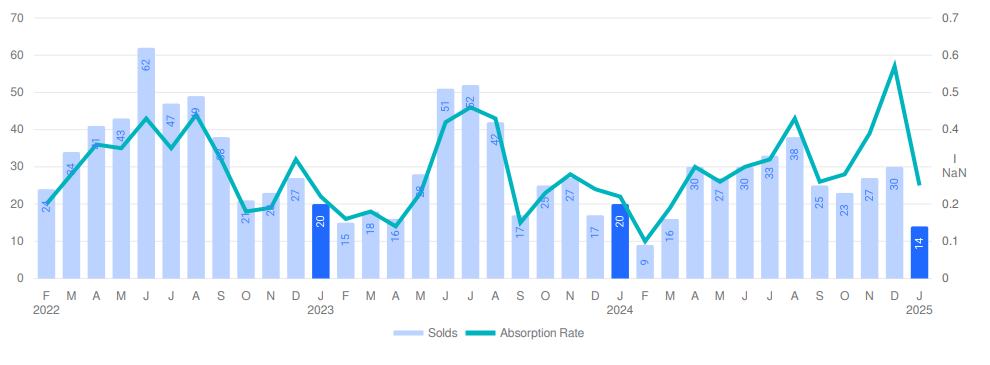
Westport, CT Number of Properties Sold and Absorption Rate
February, 2025
The number of properties sold in January 2025 was 14, down -53.33% from 30 from the previous month and -30.0% lower than 20 from January 2024. The January 2025 sales were at its lowest level compared to January 2024 and 2023. Absorption rate is the avg number of sales per month divided by the total number of available properties.
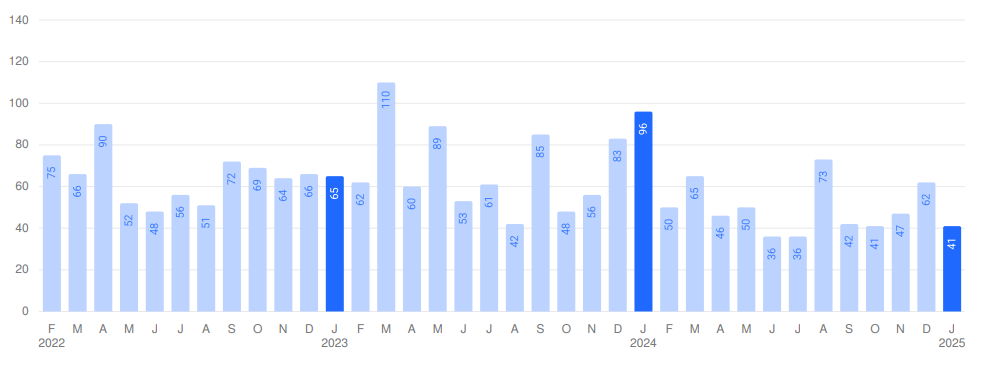
Westport, CT Average Days on Market (DOM)
February, 2025
The average days on market (DOM) is the number of days a property is on the market before it sells. An upward trend in DOM tends to indicate a move towards a buyer’s market, a downward trend tends to indicate a move towards seller’s market. The DOM for January 2025 was 41 days, down -33.87% from 62 days from the previous month and -57.29% lower than 96 days from January 2024. The January 2025 DOM was at its lowest level compared with January 2024 and 2023.
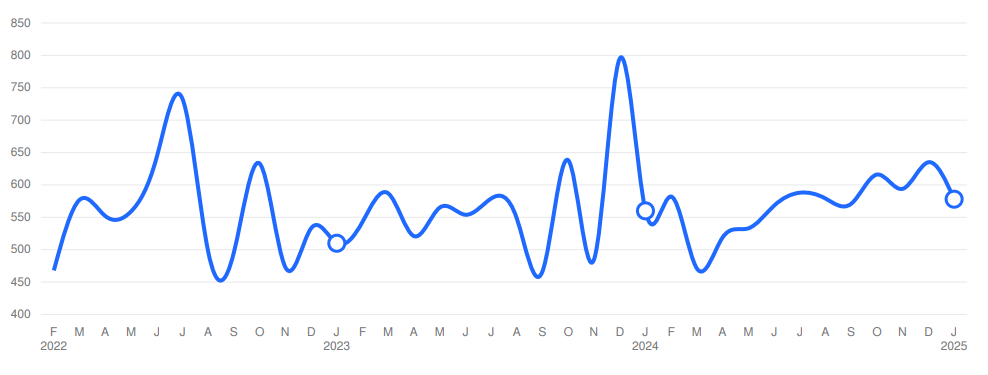
Westport, CT Average Sales Price per Square Foot
February, 2025
The average sales price per square foot is a more normalized indicator for the direction of property value. The sales price per square foot in January 2025 was $578, down -8.98% from $635 from the previous month and 3.21% higher than $560 from January 2024.
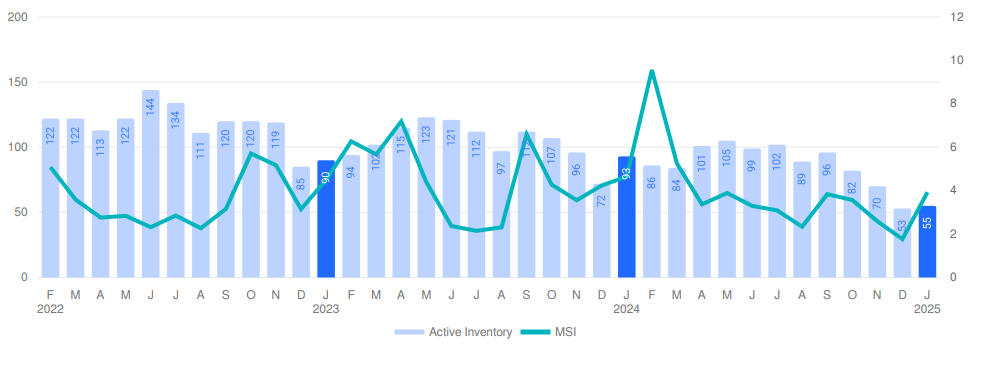
Westport, CT Inventory & MSI
February, 2025
The number of properties for sale in January 2025 was 55, up 3.77% from 53 from the previous month and -40.86% lower than 93 from January 2024. The January 2025 inventory was at its lowest level compared with January 2024 and 2023. A comparatively lower MSI is more beneficial for sellers while a higher MSI is better for buyers. The January 2025 MSI of 3.93 months was at its lowest level compared with January 2024 and 2023.
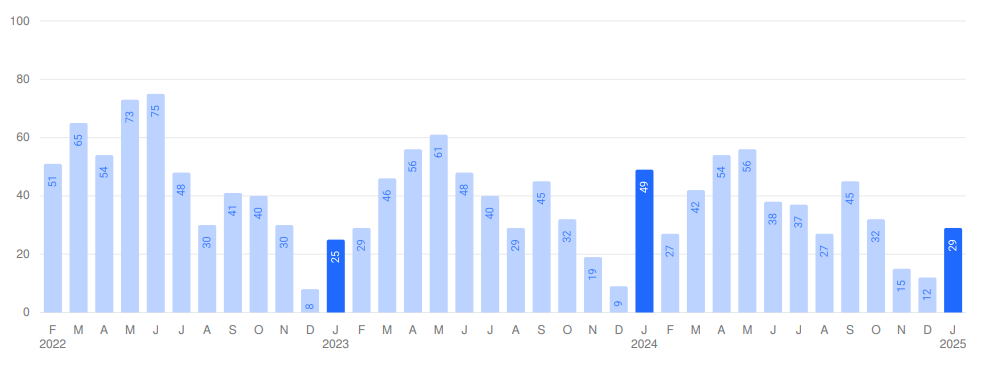
Westport, CT New Listings
February, 2025
The number of new listings in January 2025 was 29, up 141.67% from 12 from the previous month and -40.82% lower than 49 from January 2024. The January 2025 listings were at a mid level compared to January 2024 and 2023.
©2025 Coldwell Banker. All Rights Reserved. Coldwell Banker and the Coldwell Banker logos are trademarks of Coldwell Banker Real Estate LLC. The Coldwell Banker® System is comprised of company owned offices which are owned by a subsidiary of Realogy Brokerage Group LLC and franchised offices which are independently owned and operated. The Coldwell Banker System fully supports the principles of the Fair Housing Act and the Equal Opportunity Act.

Based on information from SmartMLS for the period 02/01/2022 through 1/31/2025. Source data is deemed reliable but not guaranteed. Real estate agents affiliated with Coldwell Banker Realty are independent contractor sales associates, not employees.