Westport, CT July 2024 Real Estate Market Insights & Forecasts
City: Westport, CT
Assembled by: Judy Michaelis, 203-247-5000
Westport, CT Real Estate Market Update, July 2024
Westport homeowners,
Westport presents a tale of two markets.
First, for sellers with properly staged and competitively priced listings.
The market remains strong. For example, a recent Westport listing with a market value of around $3.25 million was listed at only $3.1 million. This sparked a frenzy of multiple offers and closed for over 3.5 million, all cash with no contingencies. A seller’s dream.
On the other hand, the unstaged or overpriced listings, even those priced at market value, tend to sit in the market longer, giving buyers more leverage and negotiation power. Unlike the market of 2021 and 2022, when it seemed everything – even a cardboard box – would sell; today’s market is much more selective.
Many buyers, frankly, struggle to see the potential in unstaged homes and simply ignore them. Shrewd buyers, however, view such homes as an opportunity to find a bargain. The trend is clear. Homes that entice multiple offers are selling above the market value, while those that linger on the market sell for less.
🤔 If you’ve been considering selling your home, I’d love to chat with you.
I can go through the market data that may impact the sale of your home and help you start preparing it for sale, even if you’re not quite ready yet.
Have a look at the numbers below, and let me know what you think!
Sitting down with a top realtor is vital in helping you understand your options. If you’d like to know what’s going on in your part of Westport, or you’re looking for any further detailed analysis, feel free to call, text, or email me – I’d love to have a personal conversation with you. If you like what you see and hear in my videos, just subscribe above!
– Judy
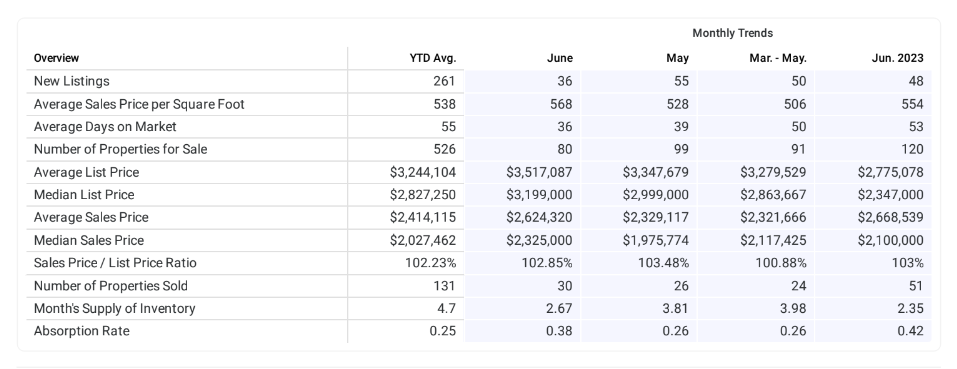
Westport, CT Real Estate Market & Trends Overview
July, 2024
The overview below shows real estate activity from January 2024 to June 2024. You will see data comparisons between June and the previous month, the last three months and June 2023.
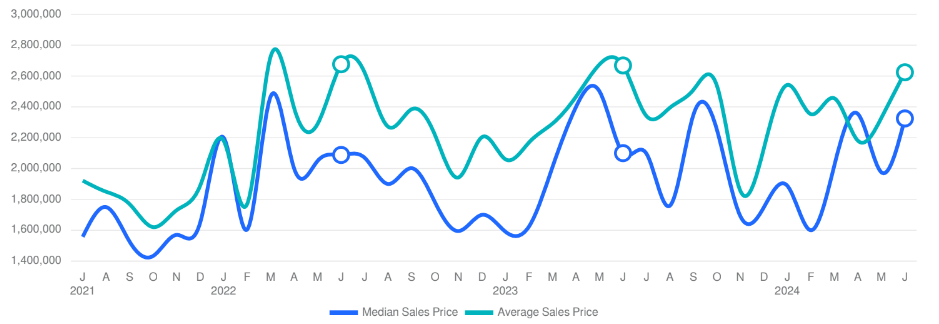
Westport, CT Average and Median Home Sales Prices
July, 2024
The median sales price in June 2024 was $2,325,000, up 17.68% from $1,975,774 from the previous month and 10.71% higher than $2,100,000 from June 2023. The June 2024 median sales price was at its highest level compared to June 2023 and 2022. The average sales price in June 2024 was $2,624,320, up 12.67% from $2,329,117 from the previous month and -1.66% lower than $2,668,539 from June 2023. The June 2024 average sale price was at its lowest level compared to June 2023 and 2022.
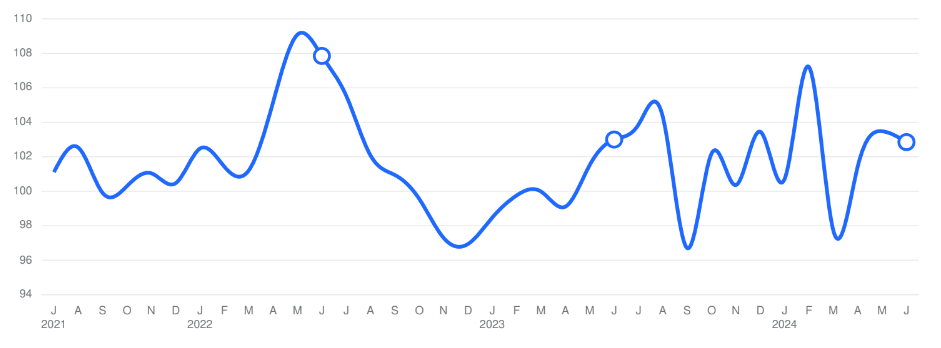
Westport, CT Sales Price / List Price Ratio
July, 2024
The sales price/list price ratio is the average sale price divided by the average list price for sold properties expressed as a percentage. If it is above 100%, homes are selling for more than the list price. If it is less than 100%, homes are selling for less than the list price. The June 2024 sales price/list price ratio was 102.85%, equal to the previous month and equal to June 2023.
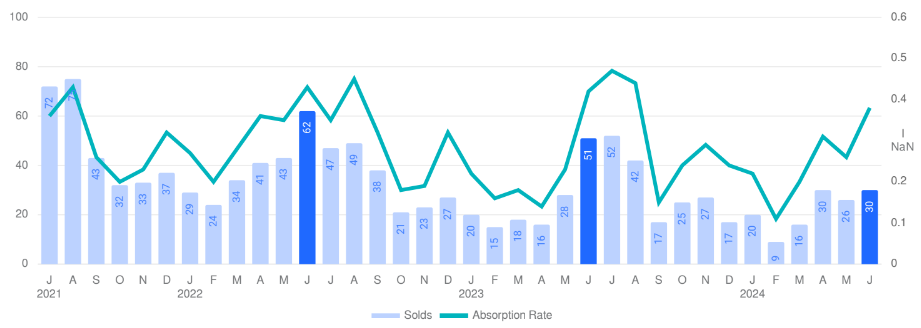
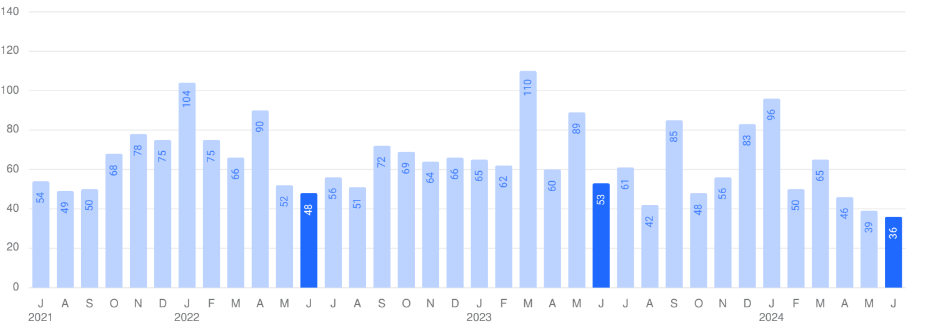
Westport, CT Number of Properties Sold and Absorption Rate
July, 2024
The number of properties sold in June 2024 was 30, up 15.38% from 26 from the previous month and -41.18% lower than 51 from June 2023. The June 2024 sales were at its lowest level compared to June 2023 and 2022. Absorption rate is the avg. number of sales per month divided by the total number of available properties.
Westport, CT Average Days on Market (DOM)
July, 2024
The average days on market (DOM) is the number of days a property is on the market before it sells. An upward trend in DOM tends to indicate a move towards a buyer’s market, a downward trend tends to indicate a move towards seller’s market. The DOM for June 2024 was 36 days, down -7.69% from 39 days from the previous month and -32.08% lower than 53 days from June 2023. The June 2024 DOM was at its lowest level compared with June 2023 and 2022.
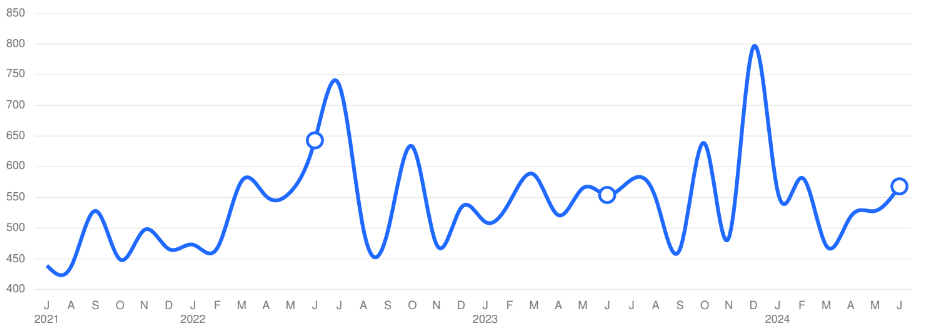
Westport, CT Average Sales Price per Square Foot
July, 2024
The average sales price per square foot is a more normalized indicator for the direction of property value. The sales price per square foot in June 2024 was $568, up 7.58% from $528 from the previous month and 2.53% higher than $554 from June 2023.
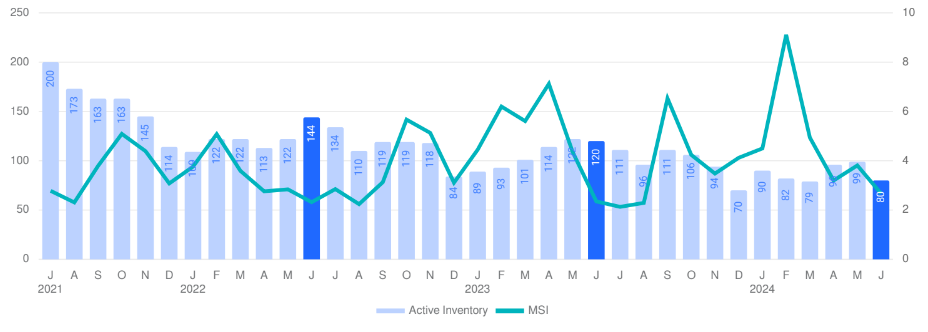
Westport, CT Inventory & MSI
July, 2024
The number of properties for sale in June 2024 was 80, down -19.19% from 99 from the previous month and -33.33% lower than 120 from June 2023. The June 2024 inventory was at its lowest level compared with June 2023 and 2022. A comparatively lower MSI is more beneficial for sellers while a higher MSI is better for buyers. The June 2024 MSI of 2.67 months was at its highest level compared with June 2023 and 2022.
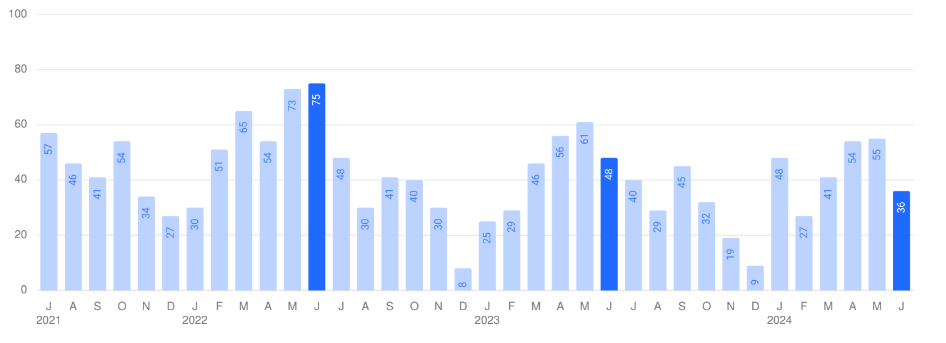
Westport, CT New Listings
July, 2024
The number of new listings in June 2024 was 36, down -34.55% from 55 from the previous month and -25.00% lower than 48 from June 2023. The June 2024 listings were at its lowest level compared to June 2023 and 2022.
©2024 Coldwell Banker. All Rights Reserved. Coldwell Banker and the Coldwell Banker logos are trademarks of Coldwell Banker Real Estate LLC. The Coldwell Banker® System is comprised of company owned offices which are owned by a subsidiary of Realogy Brokerage Group LLC and franchised offices which are independently owned and operated. The Coldwell Banker System fully supports the principles of the Fair Housing Act and the Equal Opportunity Act.

Based on information from SmartMLS for the period 07/01/2021 through 6/30/2024. Source data is deemed reliable but not guaranteed. Real estate agents affiliated with Coldwell Banker Realty are independent contractor sales associates, not employees.