Westport, CT May 2024 Real Estate Market Insights & Forecasts
CITY: WESTPORT, CT
BY: JUDY MICHAELIS, 203-247-5000
Westport homeowners,
Have a look at the numbers below, and let me know what you think!
Sitting down with a top realtor is vital in helping you understand your options. If you’d like to know what’s going on in your part of Westport, or you’re looking for any further detailed analysis, feel free to call, text, or email me – I’d love to have a personal conversation with you. If you like what you see and hear in my videos, just subscribe above!
– Judy
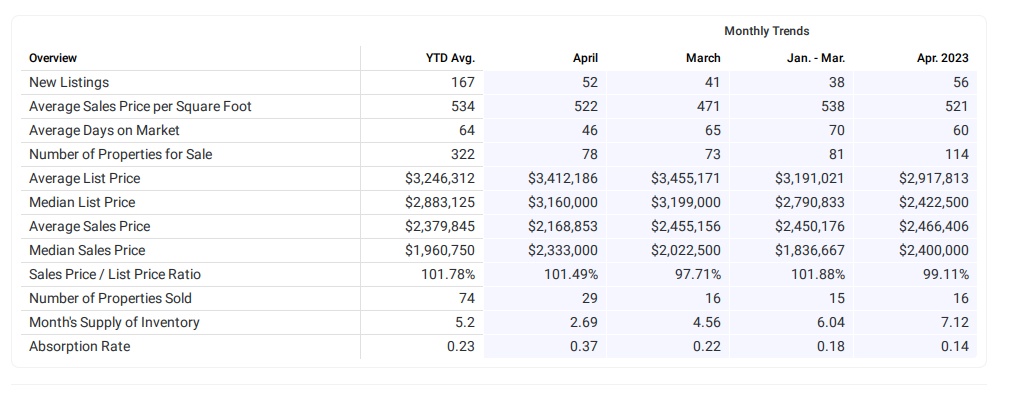
Westport, CT Real Estate Market & Trends Overview
MAY, 2024
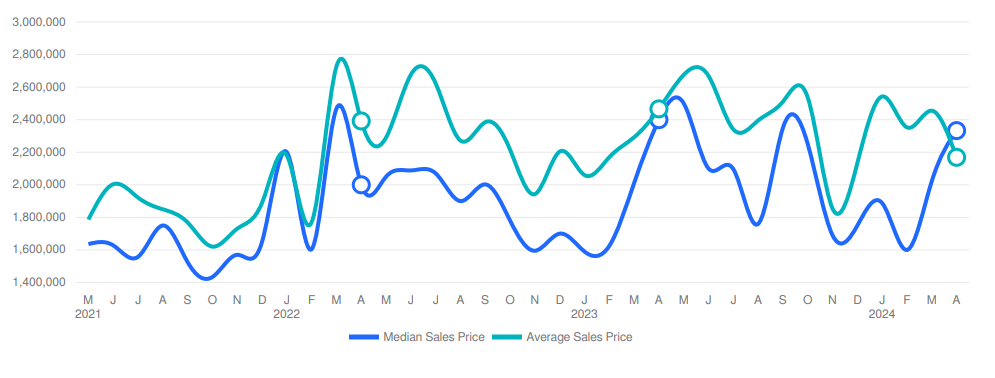
Westport, CT Average and Median Home Sales Prices
MAY, 2024
The median sales price in April 2024 was $2,333,000, up 15.35% from $2,022,500 from the previous month and -2.79% lower than $2,400,000 from April 2023. The April 2024 median sales price was at a mid level compared to April 2023 and 2022. The average sales price in April 2024 was $2,168,853, down -11.66% from $2,455,156 from the previous month and -12.06% lower than $2,466,406 from April 2023. The April 2024 average sale price was at its lowest level compared to April 2023 and 2022.
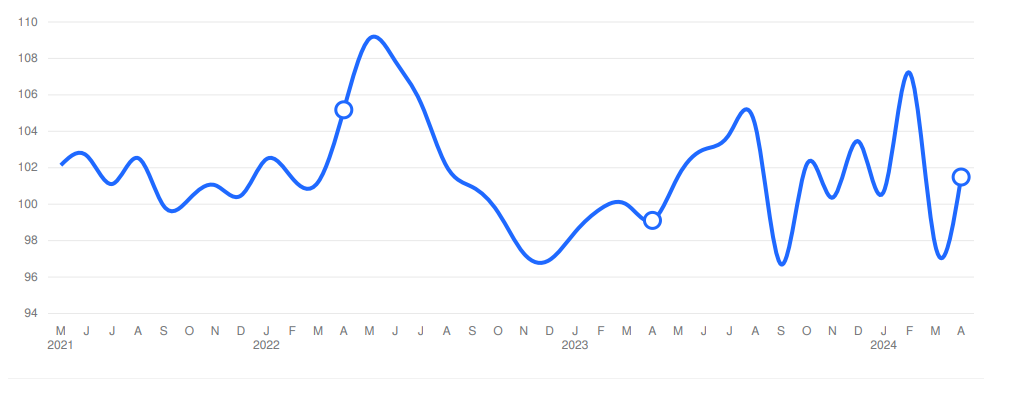
Westport, CT Sales Price / List Price Ratio
MAY, 2024
The sales price/list price ratio is the average sale price divided by the average list price for sold properties expressed as a percentage. If it is above 100%, homes are selling for more than the list price. If it is less than 100%, homes are selling for less than the list price. The April 2024 sales price/list price ratio was 101.49%, up from 97.71% from the previous month and up from 99.11% from April 2023.
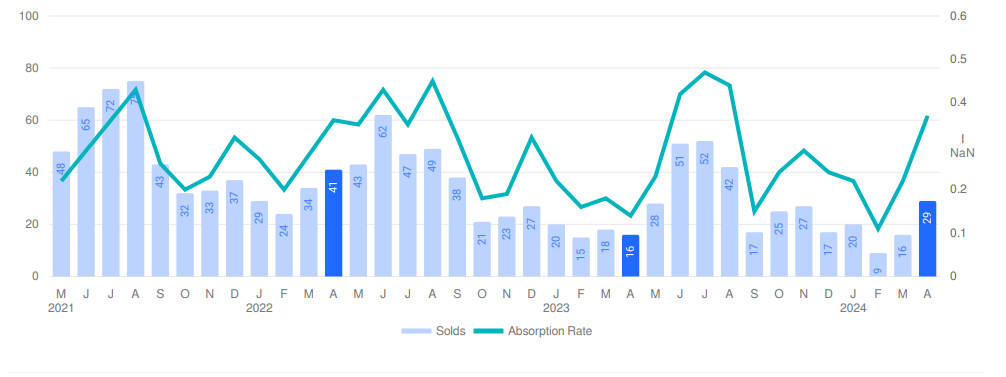
Westport, CT Number of Properties Sold and Absorption Rate
MAY, 2024
The number of properties sold in April 2024 was 29, up 81.25% from 16 from the previous month and 81.25% higher than 16 from April 2023. The April 2024 sales were at a mid level compared to April 2023 and 2022. Absorption rate is the avg number of sales per month divided by the total number of available properties.
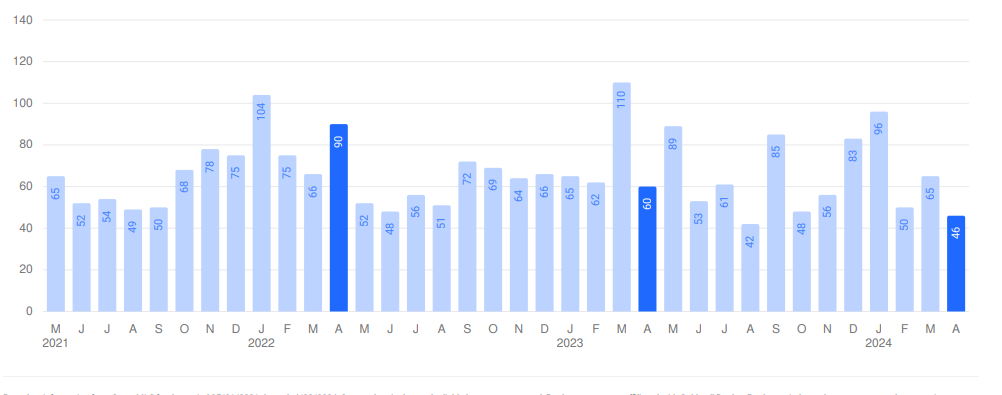
Westport, CT Average Days on Market (DOM)
MAY, 2024
The average days on market (DOM) is the number of days a property is on the market before it sells. An upward trend in DOM tends to indicate a move towards a buyer’s market, a downward trend tends to indicate a move towards seller’s market. The DOM for April 2024 was 46 days, down -29.23% from 65 days from the previous month and -23.33% lower than 60 days from April 2023. The April 2024 DOM was at its lowest level compared with April 2023 and 2022.
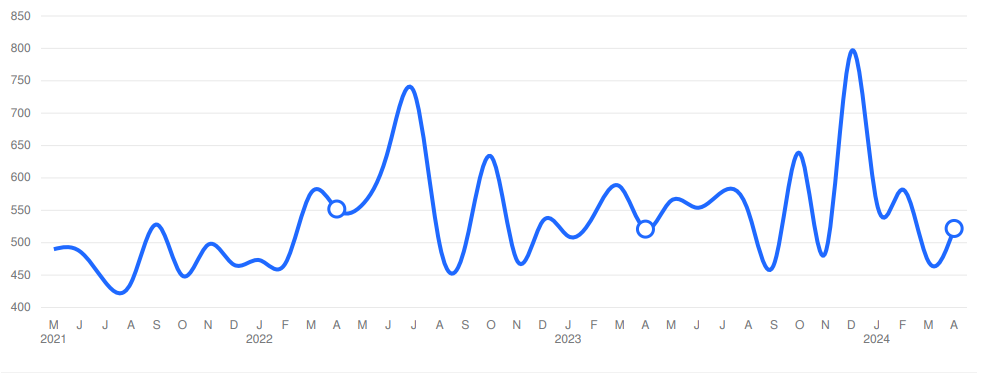
Westport, CT Average Sales Price per Square Foot
MAY, 2024
The average sales price per square foot is a more normalized indicator for the direction of property value. The sales price per square foot in April 2024 was $522, up 10.83% from $471 from the previous month and equal to April 2023.
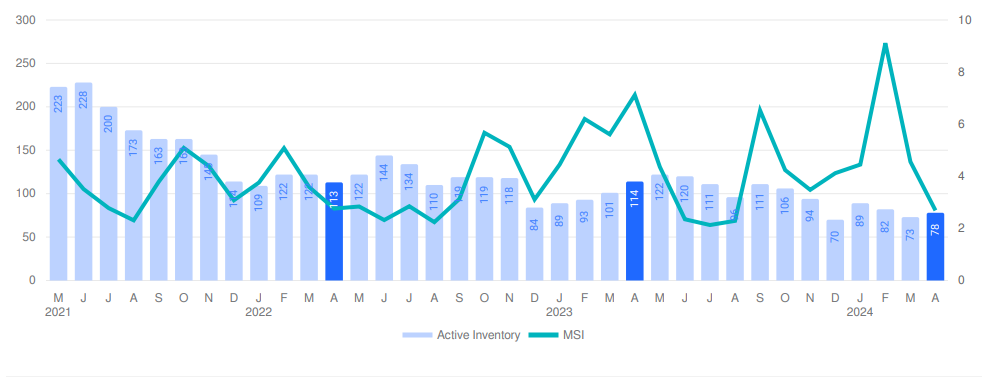
Westport, CT Inventory & MSI
MAY, 2024
The number of properties for sale in April 2024 was 78, up 6.85% from 73 from the previous month and -31.58% lower than 114 from April 2023. The April 2024 inventory was at its lowest level compared with April 2023 and 2022. A comparatively lower MSI is more beneficial for sellers while a higher MSI is better for buyers. The April 2024 MSI of 2.69 months was at its lowest level compared with April 2023 and 2022.
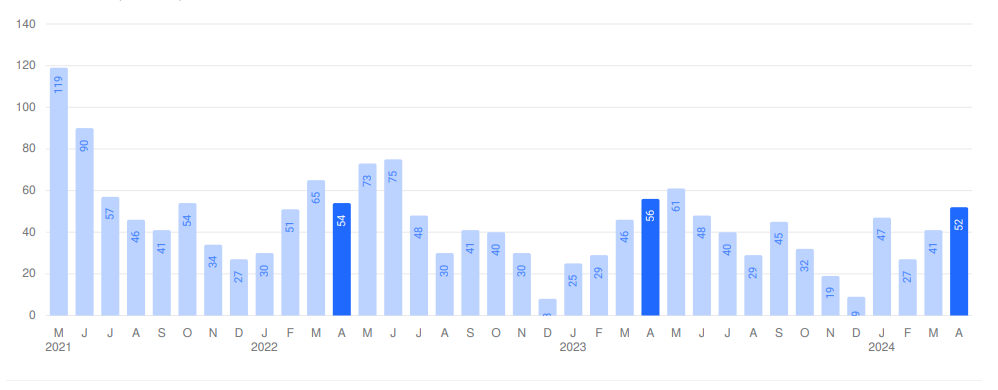
Westport, CT New Listings
MAY, 2024
The number of new listings in April 2024 was 52, up 26.83% from 41 from the previous month and -7.14% lower than 56 from April 2023. The April 2024 listings were at its lowest level compared to April 2023 and 2022.
©2024 Coldwell Banker. All Rights Reserved. Coldwell Banker and the Coldwell Banker logos are trademarks of Coldwell Banker Real Estate LLC. The Coldwell Banker® System is comprised of company owned offices which are owned by a subsidiary of Realogy Brokerage Group LLC and franchised offices which are independently owned and operated. The Coldwell Banker System fully supports the principles of the Fair Housing Act and the Equal Opportunity Act.

Based on information from SmartMLS for the period 05/01/2021 through 4/30/2024. Source data is deemed reliable but not guaranteed. Real estate agents affiliated with Coldwell Banker Realty are independent contractor sales associates, not employees.